Spring 2020
Platform-wide orchestration
Allow Data Scientists and Machine Learning Operations Engineers to create automated processes out of data, ML models, and more.
Research*UI*UX*Software*StrategyInception
Unlike any tool of its kind, this canvas based UI will enable Data Scientists and Machine Learning Operations Engineers to automate operations between platform assets to control end to end lifecycle processes. The tool will be built to be compatible with the open-source Kubeflow tool for easy user adoption. The tool is currently in development and has not been released to the public.
My contribution
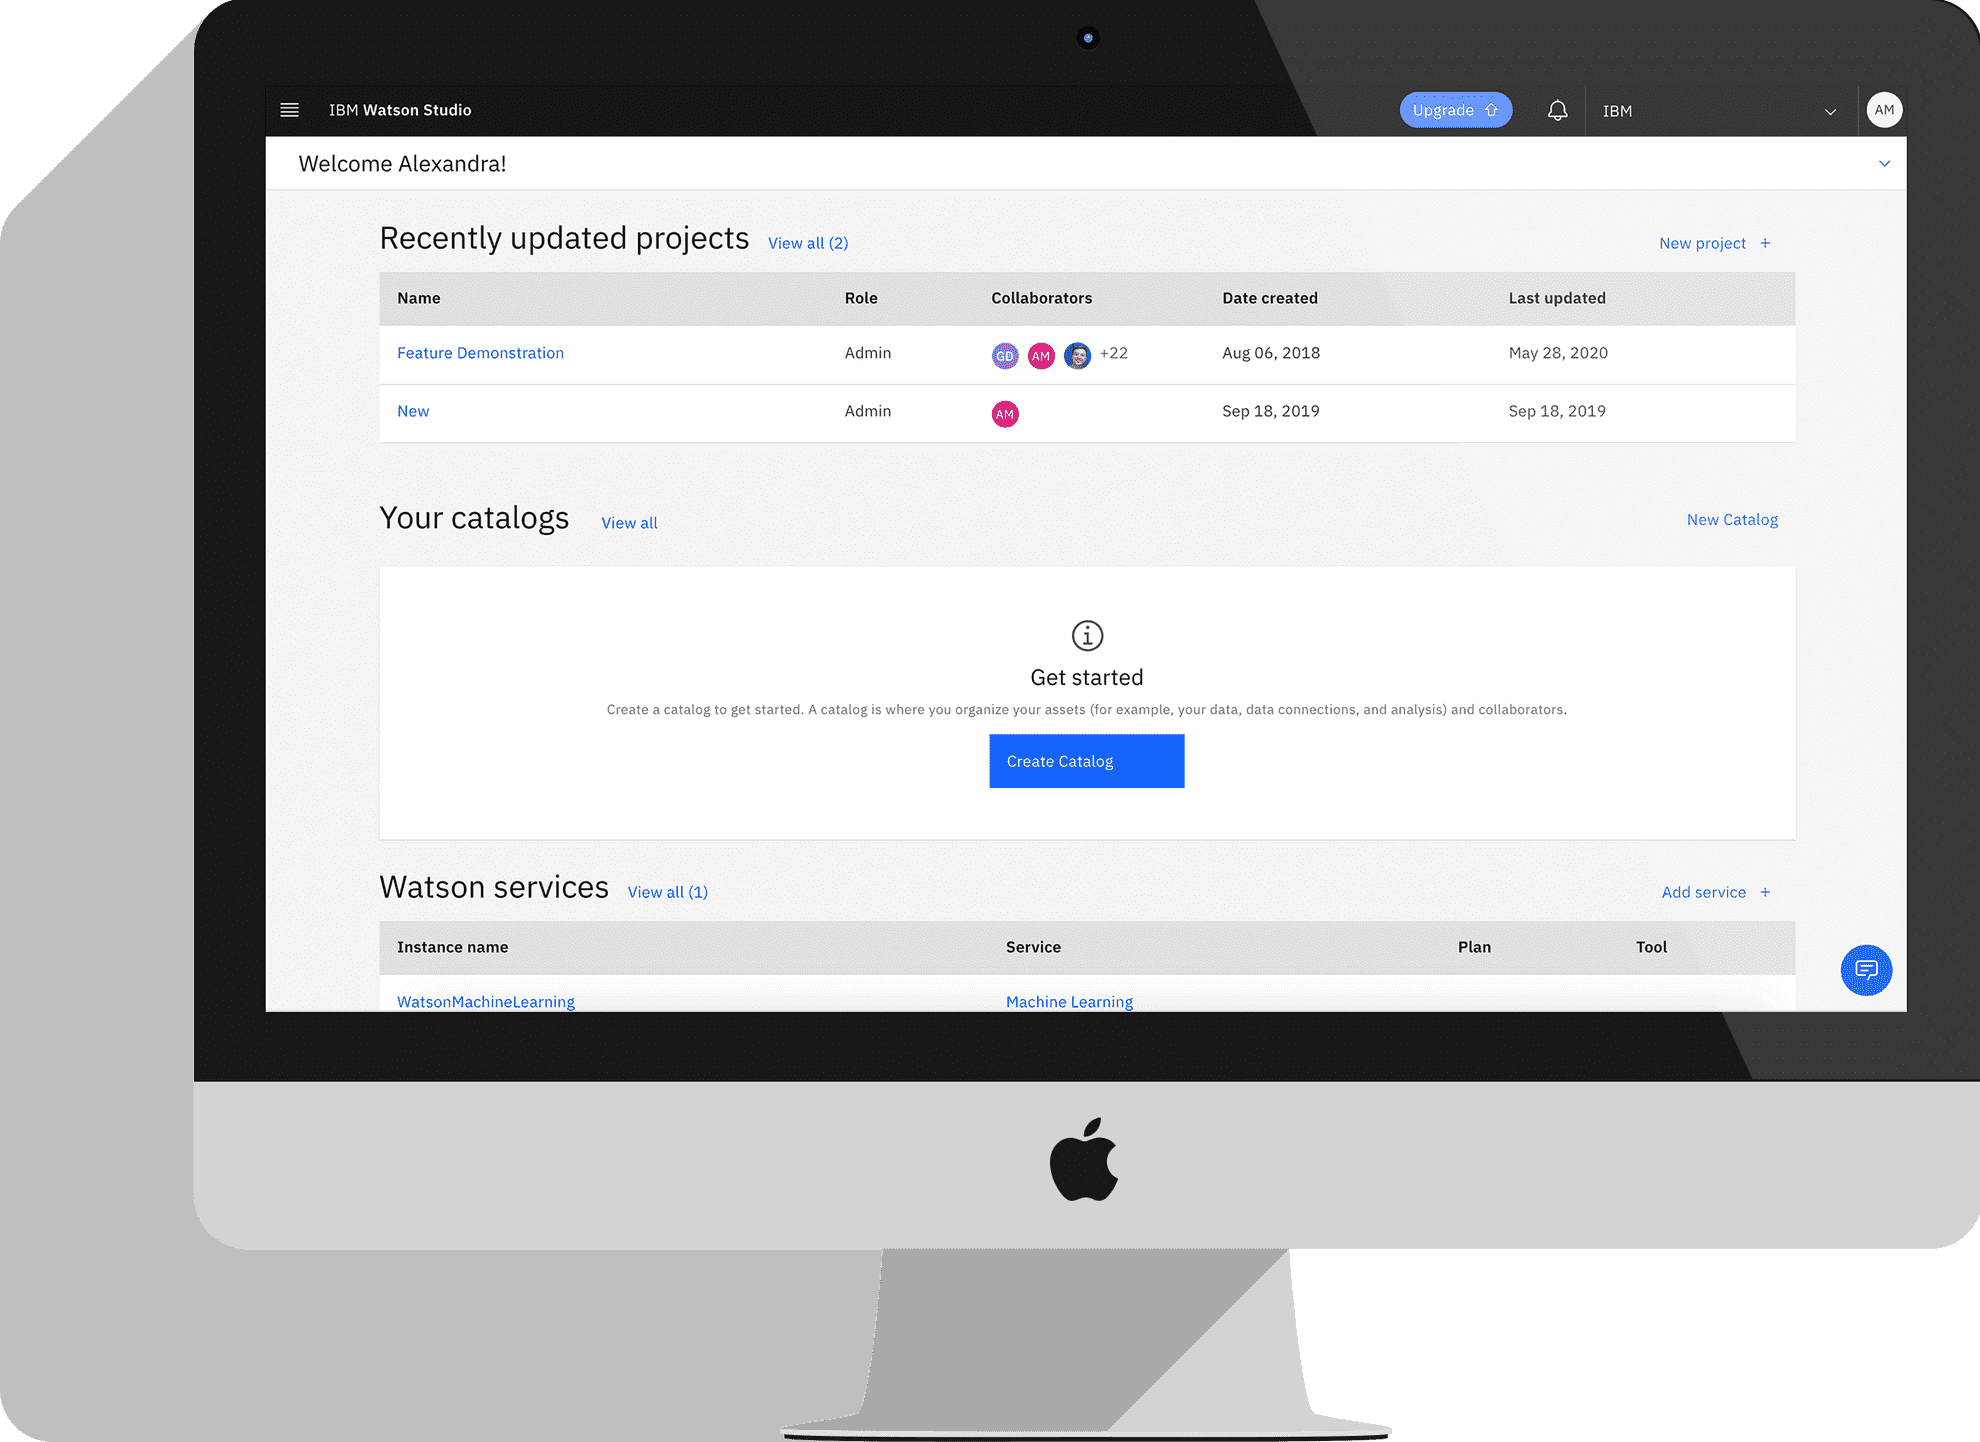
I was the lead designer for the orchestration editor tool that will appear in Watson Studio and Cloud Pak for Data at the end of 2020. I directed weekly syncs to showcase the evolution of the design to a cross-functional team of Developers, System Architects, Data Scientists, and Product Managers across four time zones (from San Francisco to Poland).
Tools
- Keynote
- Sketch
- Invision
- Mural
Creating a vision
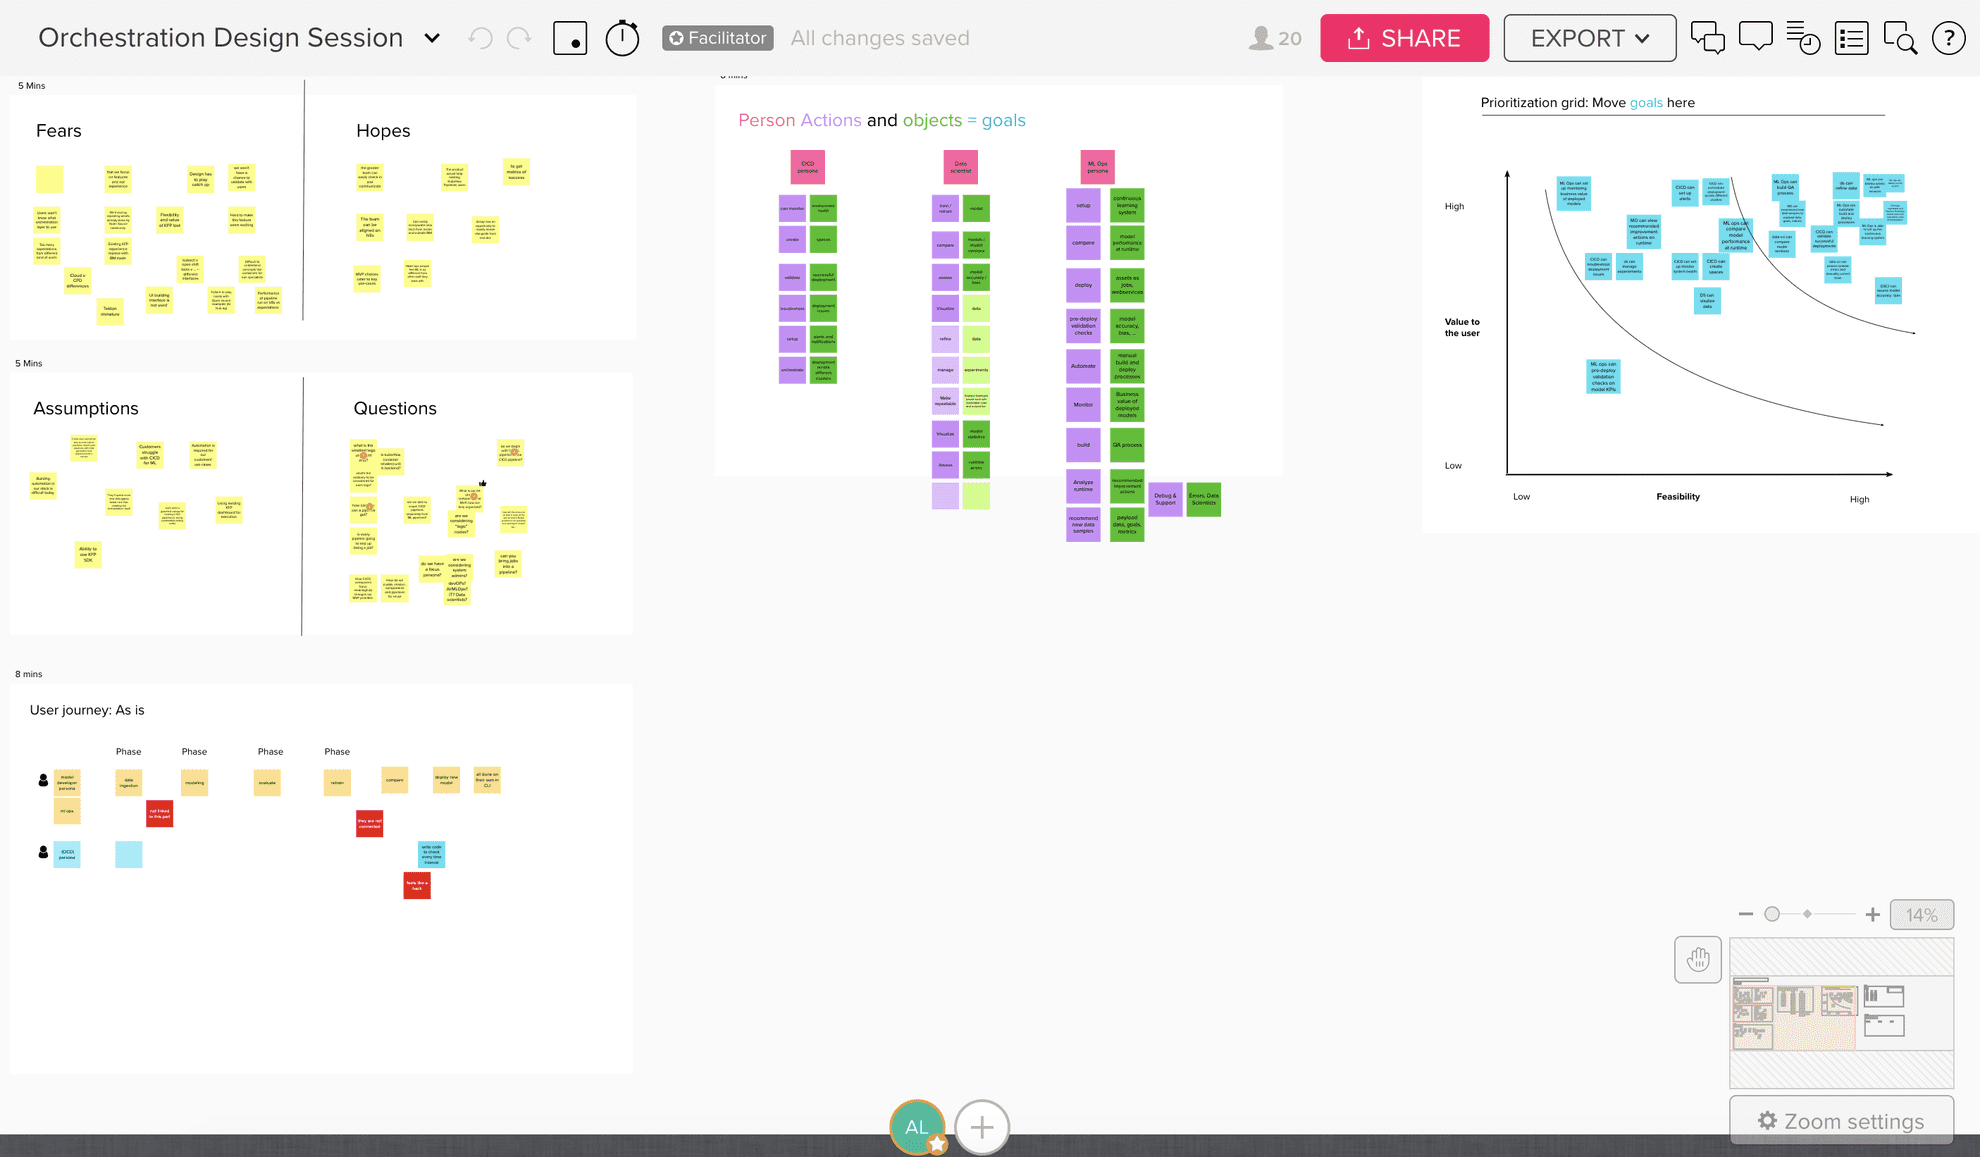
I created and facilitated a design session for our cross-functional team via Mural to begin aligning on a vision. The tightly packed agenda of six exercises in one hour allowed a forum for 20 teammates to ultimately reveal their vision without technical constraints. All the exercises were chosen based on the nature of the event: virtual, fast, and direct. Below is an overview of some of the exercises:
1. Hopes and Fears: Team members start the dialog by opening up about insecurities which directly squashes imposter syndrome by revealing other teammates have similar concerns. This built trust amongst a new team and opened a dialogue on the product vision.
2. Assumptions and Questions: Because our team was spread across four time zones it was important to note what was known and not known about the project. Communication continued to be the biggest challenge throughout the project and by starting here, we all began on the same playing field.
3. As-is journey mapping: Ending the first half of the design session, we mapped how users accomplish their goals currently, with no solution in place. This revealed pain points that I addressed when it was time for me to prototype.
4. People + Actions + Objects: The second half of the session got down into the Who is our user? What actions do they need to take? What objects do they need? This revealed goals that we then prioritized into a draft product roadmap.
“Thanks Alex! I thought todays’ session was very useful, and we got quite a lot of ideas out on the table in 1 hour. I think we clearly saw there were some different viewpoints on the personas involved. I’ve spent much longer in design thinking sessions and accomplished less.”
- Technical Product Manager and Lead Platform Architect
This session led to a vision deck that I presented back to the team. It was a synthesis of everything shared on Mural plus my perspective on where the design should head.
Who, what, when, where?
At this stage, I learned basic answers to these questions that allowed me enough understanding to start prototyping.
Who: Data Scientists and ML Ops Engineers
What: Combine a number of data analytics assets and actions (such as data, databases, data flows, ML models, accuracy checks, etc) in order to build a flow across many of IBM’s existing tooling
When: After a user has created analytic assets that they want to use in active learning, learning, model deployment, or model training
Where: Accessed from either Cloud Pak for Data or Watson Studio
ChrisData Scientist
Need: Training ML models
With the orchestration editor Chris can now:
- Prepare data
- Run python notebooks
- Train and save models
- Evaluate and prepare models
RohanOps Engineer
Need: Deploy and monitor assets into production
With the orchestration editor Rohan can now:
- Run assets created by Chris and other data scientists
- Deploy assets into production
- Configure model monitoring
Syncing designs across IBM
Within IBM Data and AI, there are four canvas based tool teams ranging in maturity from two to 10 years old. Each team is based on a common canvas which gets customized per the tools individual needs. I reached out to these teams for feedback which allowed me to understand the design system through various applications of a canvas tool in different scenarios.
Alex Morris11:24 AM
What do you use for empty states and onboarding?
7 repliesLast reply 12 days ago
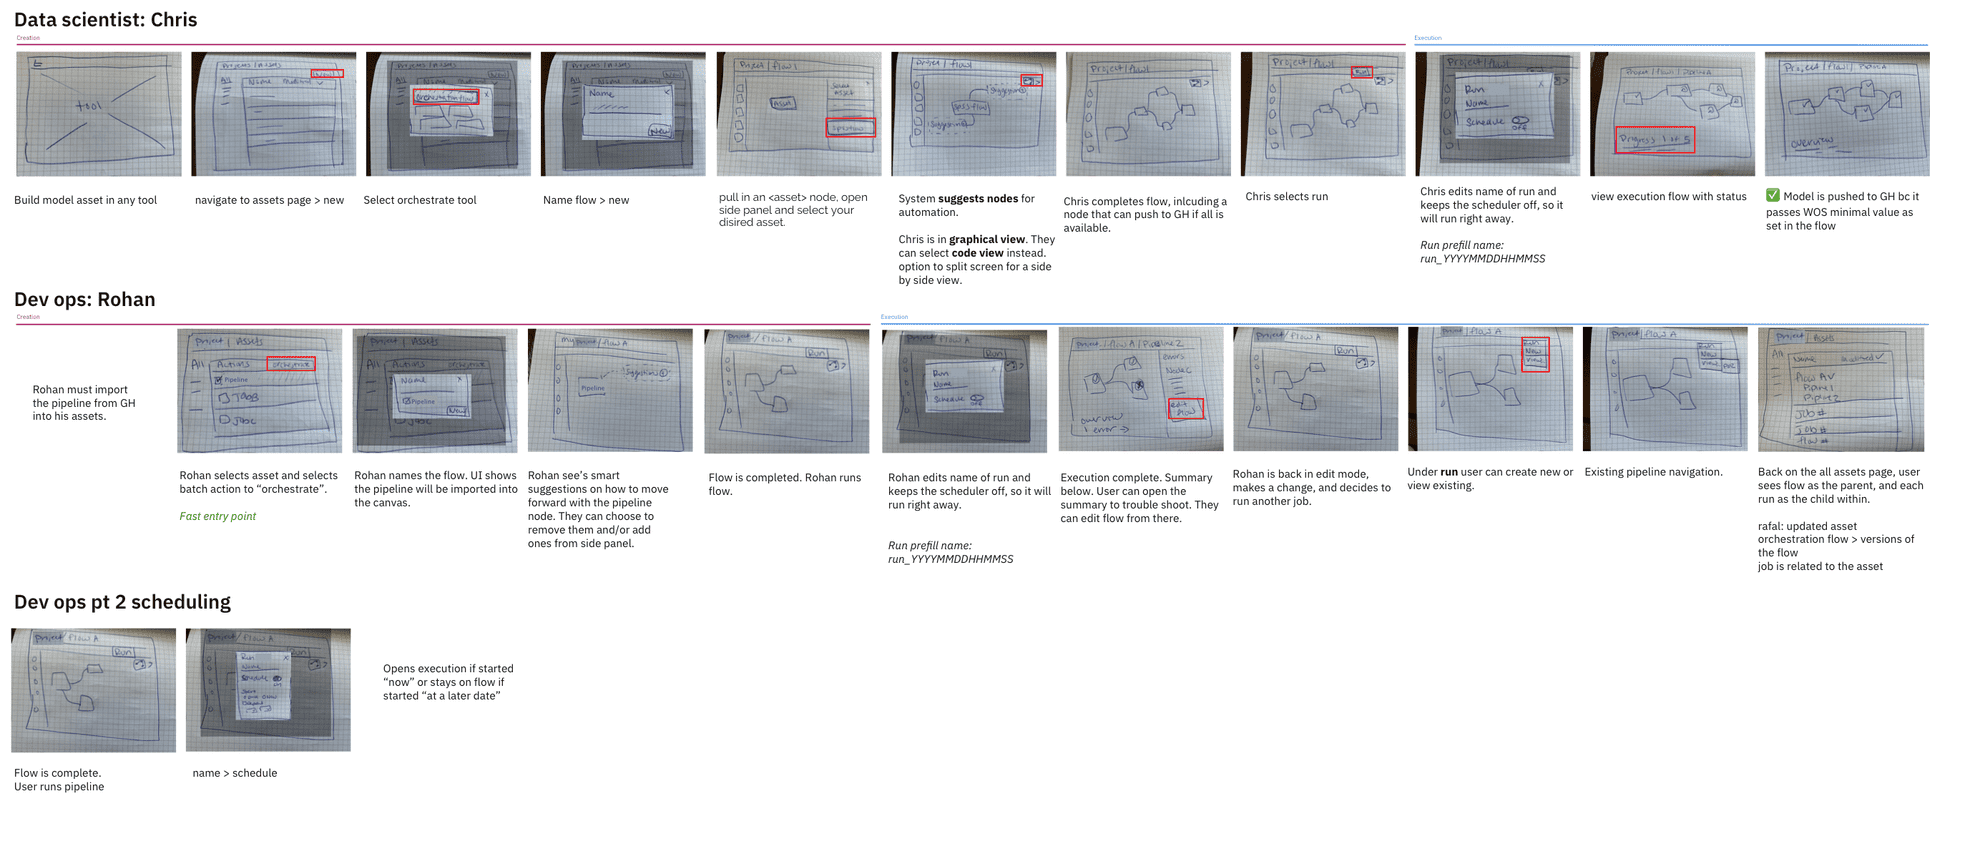
Prototyping stage
I began wireframing by combining our priorities from the design session and my knowledge from the canvas teams and sketched several user flows with different considerations such as:
- How the user should enter the tool
- What appears on the canvas and how to those objects link together
- What interactions are available in the canvas
- What actions users should take at the beginning, during, and end of their process
- What outputs does the tool create
- How does the tool link across other tools in the platform
- How users hand off to each other and communicate in the tool
The following screens were considered in our cross-functional team sync. I was able to deliver lots of ideas quickly which generated lots of conversation and more alignment towards our MVP.
Delivering on an MVP
After receiving feedback from both my team and the canvas teams across IBM Data and AI, I updated and designed an MVP flow for my team to review via Invision. Because my team had challenges meeting due to extreme differences in time zones, the Invision prototype allowed feedback and discussions to happen at any time, which sped up the process.

Wrap up
This project was handed off to another designer to execute user testing, final iteration, and hand off to developers to be released at the end of 2020.
This project will result in:
- One place to access assets (data, ML models, etc) from 8+ IBM data analytics tools
- New users with no coding experience are able to access the same functionality as their technical counterparts
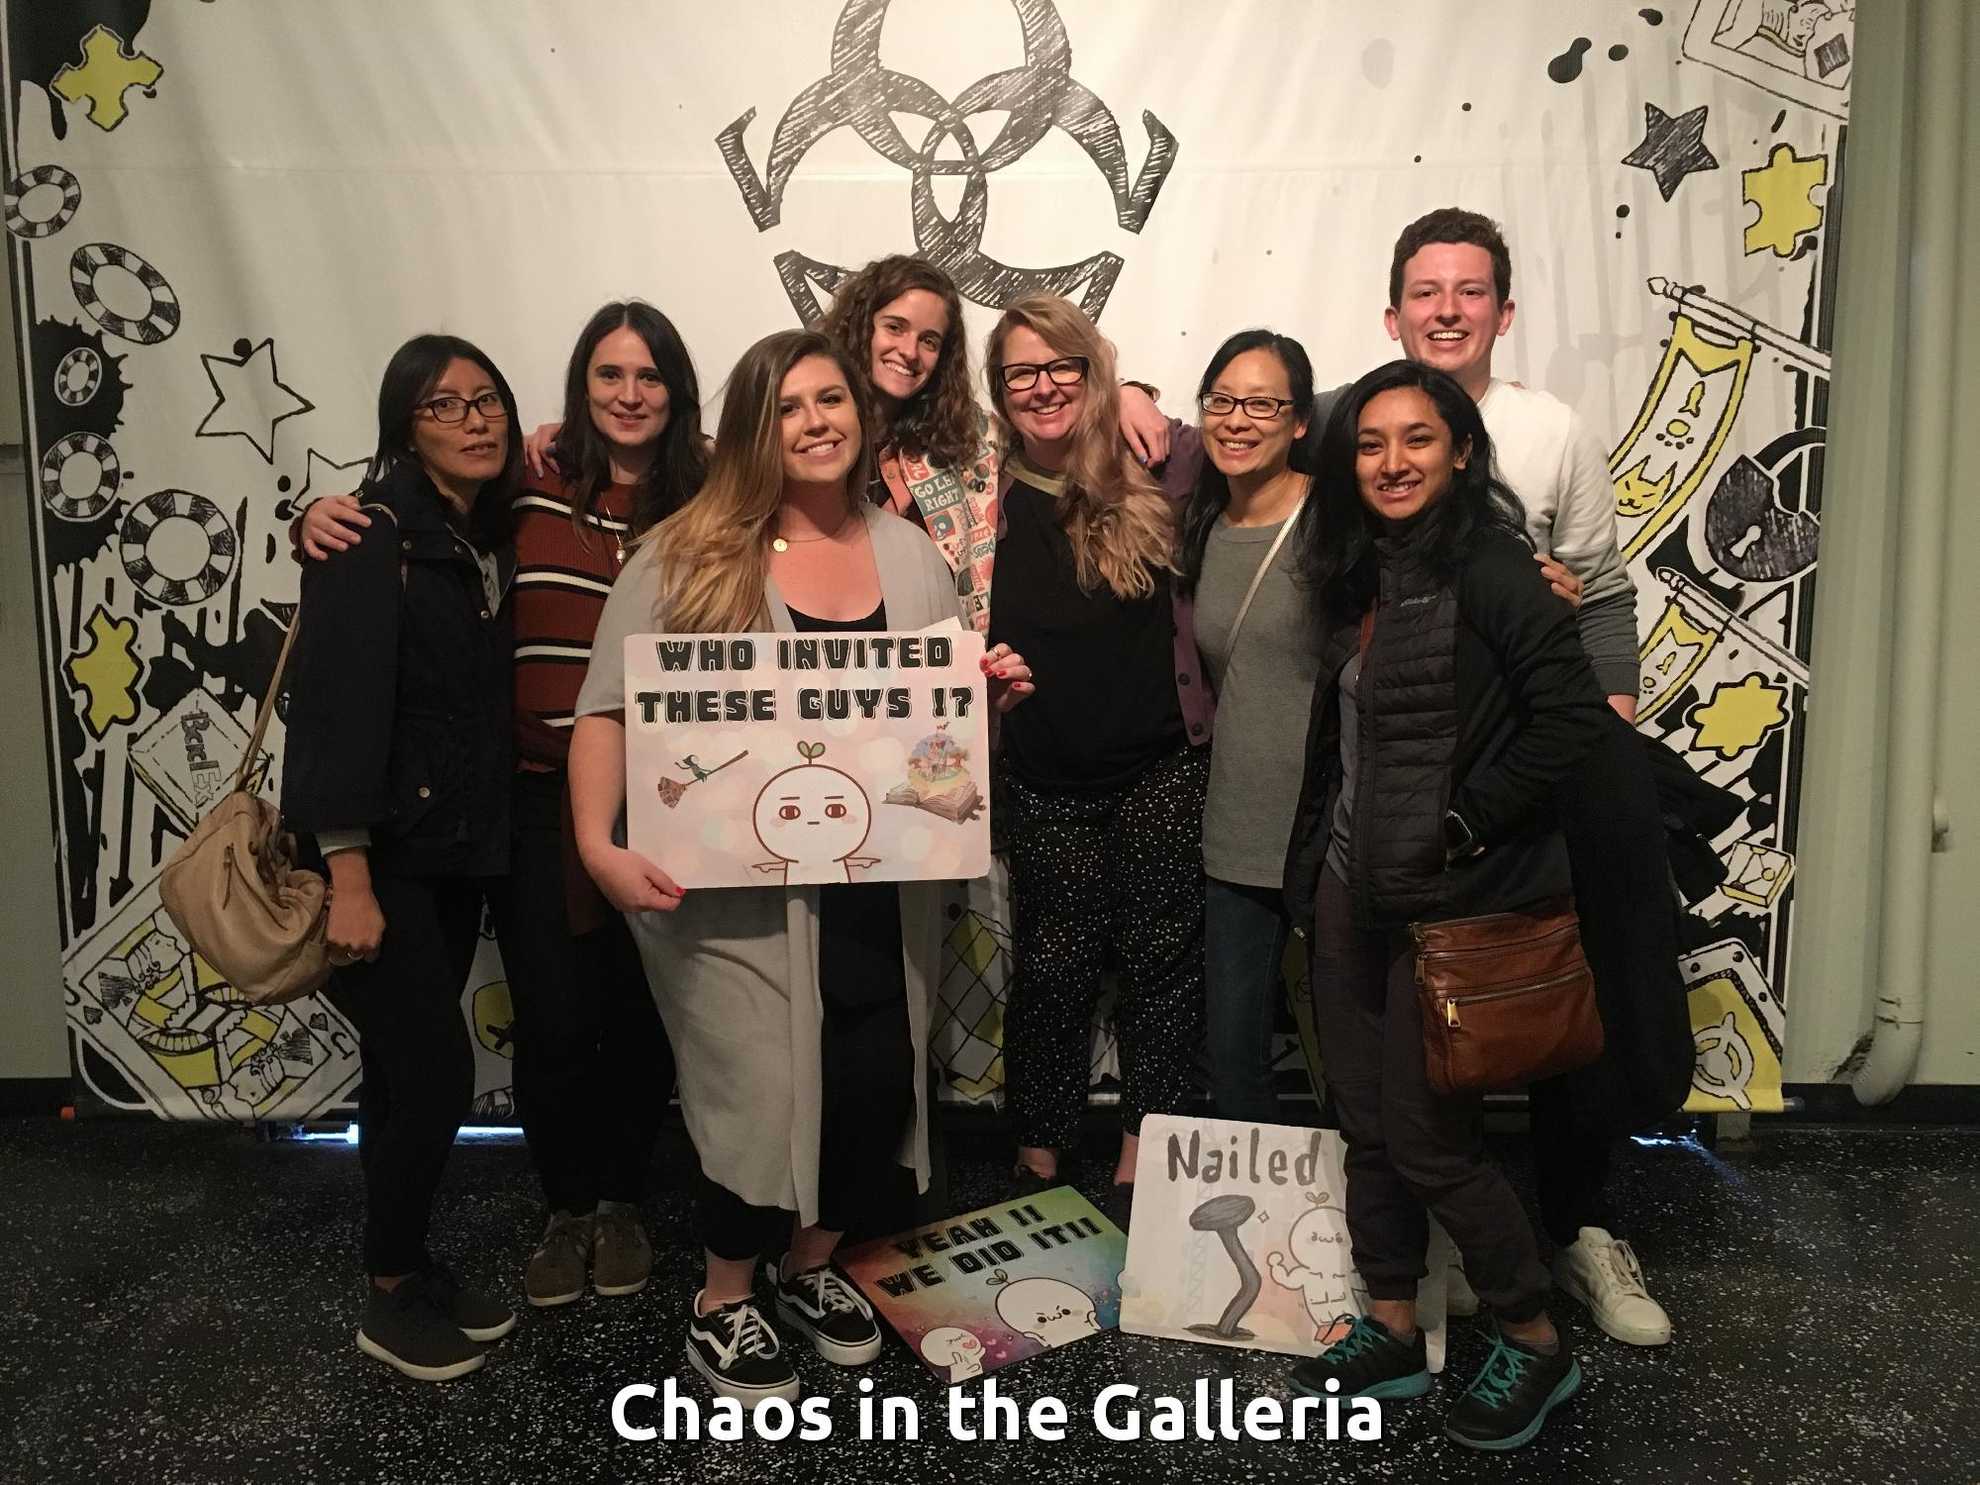
My design team after an escape room 😊
Next project
IBM Pollinate